
The outcomes are truer than ever.
The Mariners did not record a single in their first two games of 2026. No team had ever done that in major league history. In fact, only eight teams have ever gone back-to-back games without a single, according to MLB.com’s Sarah Langs.
Mariners Box Score March 26-27
The reason is obvious. The Mariners didn’t hit a single because they didn’t put the ball in play very often. And frankly, how could they? Guardians pitchers threw less than 40% of their pitches in the zone, and the Mariners were forced to lay off them, drawing walks in 13.6% of their plate appearances during those two games. When the Guardians did enter the zone, the Mariners struggled to make contact, striking out 35.8% of the time. That means only 34 (50.8%) of their plate appearances ended with a batted ball. And because the Mariners employ a number of sluggers, six of those batted balls flew over the fence.
That left just 28 balls in play that could have fallen for singles. Most were grounders gobbled up by one of the best infields in the majors. The rest were fly balls and popups easily snagged in Seattle’s cool, small outfield (T-Mobile Park suppresses BABIP almost as well as it encourages strikeouts). Three balls did eventually land in play for hits — they just happened to go for extra bases.
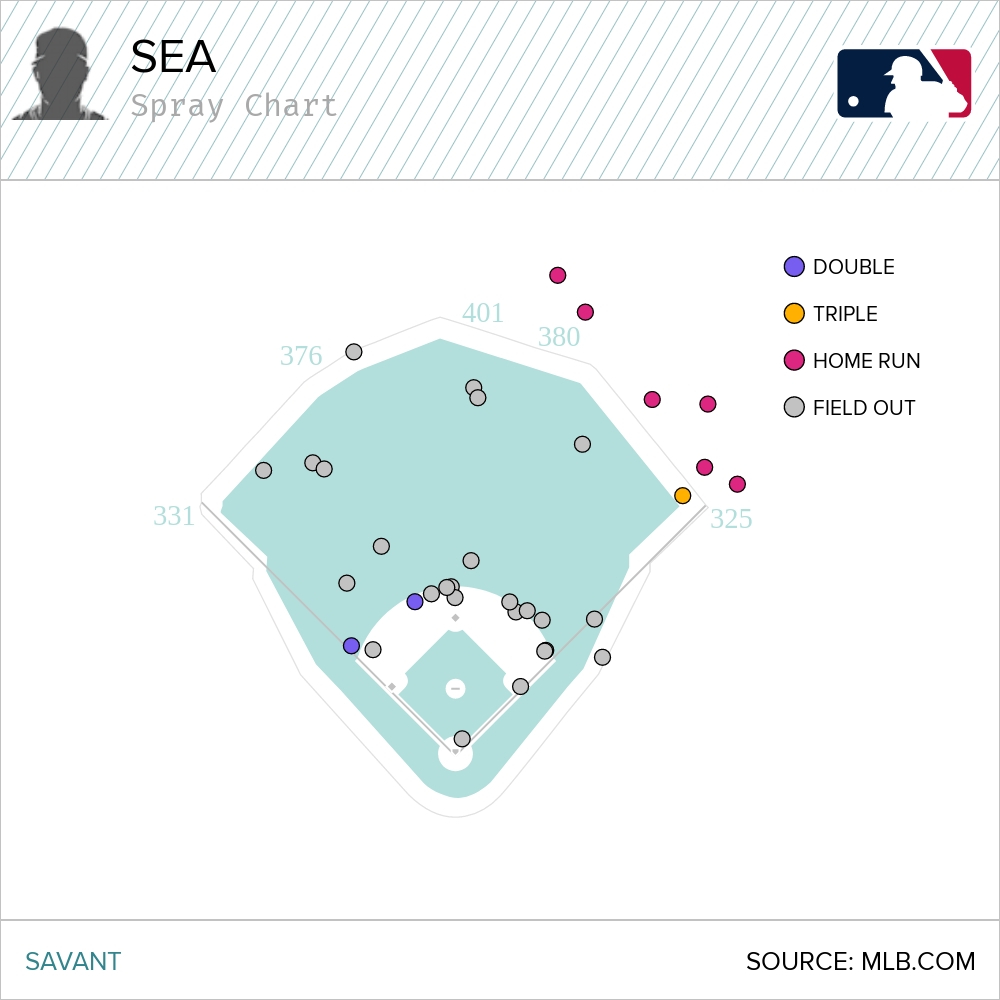
Cal Raleigh collected the Mariners’ first single in the third inning of Saturday’s game. It was his first ball in play of the season, after starting the year 0-for-8 with eight strikeouts and a walk. This is actually a nice piece of irony that Raleigh, of all people, would be the one to pick up the first single. He swings hard, up and to the pull side, and it’s rare to see him plop one into center. Nearly half his plate appearances in 2025 ended in one of the three true outcomes. He even had a 12-game stretch in July without a single, double, or triple, registering a .000 BABIP across 54 plate appearances. Was this a slump? Far from it. He drew nine walks and hit six homers to post a 127 wRC+ over those two weeks. He’s become one of several exemplars for the three true outcome approach (and aesthetic):
You Aren’t a FanGraphs Member
It looks like you aren’t yet a FanGraphs Member (or aren’t logged in). We aren’t mad, just disappointed.
We get it. You want to read this article. But before we let you get back to it, we’d like to point out a few of the good reasons why you should become a Member.
1. Ad Free viewing! We won’t bug you with this ad, or any other.
2. Unlimited articles! Non-Members only get to read 10 free articles a month. Members never get cut off.
3. Dark mode and Classic mode!
4. Custom player page dashboards! Choose the player cards you want, in the order you want them.
5. One-click data exports! Export our projections and leaderboards for your personal projects.
6. Remove the photos on the home page! (Honestly, this doesn’t sound so great to us, but some people wanted it, and we like to give our Members what they want.)
7. Even more Steamer projections! We have handedness, percentile, and context neutral projections available for Members only.
8. Get FanGraphs Walk-Off, a customized year end review! Find out exactly how you used FanGraphs this year, and how that compares to other Members. Don’t be a victim of FOMO.
9. A weekly mailbag column, exclusively for Members.
10. Help support FanGraphs and our entire staff! Our Members provide us with critical resources to improve the site and deliver new features!
We hope you’ll consider a Membership today, for yourself or as a gift! And we realize this has been an awfully long sales pitch, so we’ve also removed all the other ads in this article. We didn’t want to overdo it.
Highest Rate of Three True Outcomes (2025)
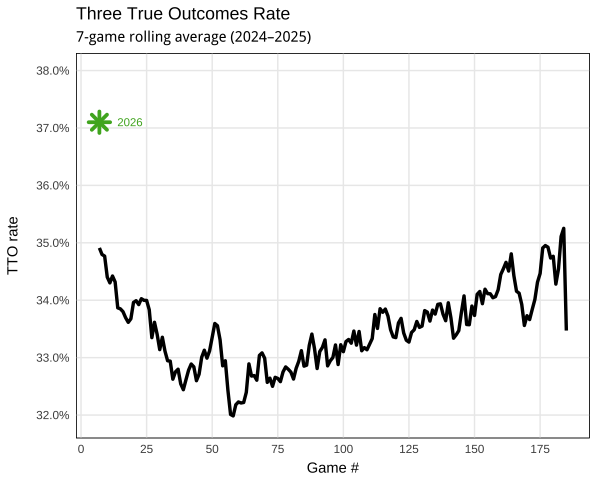
That’s a list any player would like to be on, but there might be a bit more competition to top it this year. The rate of three true outcomes has exploded across the league in the early going this season, jumping from 33.7% in 2025 to 37.1% through the first tranche of games in 2026. If it were to hold, that would be the highest mark ever. Still, we’re only one week into the season, and things will change. How?
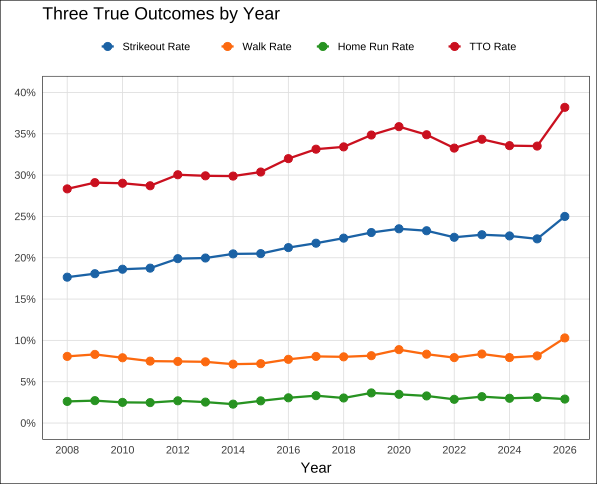
The main reason three true outcomes are up is strikeouts are up. The league strikeout rate sits at 24.5%, which would be the highest mark for a full season. This is interesting. The league’s strikeout rate appeared to plateau in 2019 after decades of growth. It even shrunk a few ticks in recent years, as batters countered increasing velocity and modern bullpen usage with new efficiencies of their own. But it seems they weren’t quite prepared for the leap in ability pitchers displayed in the first week:
League Strikeout Signal (2022-2026)
| Year | K% | Whiff% | Four-Seamer Velo (mph) | RP% |
|---|---|---|---|---|
| 2026 | 24.5% | 27.9% | 94.9 | 44.5% |
| 2025 | 22.2% | 25.3% | 94.5 | 41.6% |
| 2024 | 22.6% | 25.3% | 94.3 | 41.4% |
| 2023 | 22.8% | 25.8% | 94.2 | 42.2% |
| 2022 | 22.4% | 25.6% | 93.9 | 41.7% |
Now, the sample is extremely small, and it’s biased for a number of reasons. For instance, it includes data from each team’s best starting pitchers, and we’ll see pitcher performance go down as attrition mounts and teams turn to lesser options. This sample also includes more relievers than it will come July, as teams are reluctant to let their starting pitchers go deep into games this early in the season. We haven’t seen the shape these metrics will take in 2026.
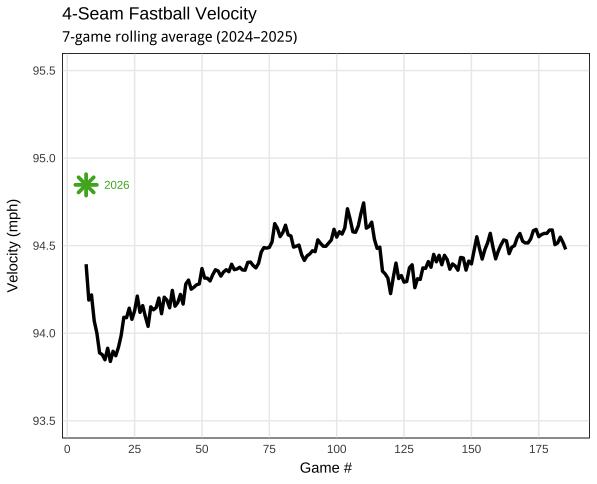
To illustrate this, I found the seven-day rolling average for all these metrics across the pitch-tracking era using the pitch-level data available from Baseball Savant. Velocity tends to spike immediately, drop, and then slowly climb throughout the summer.
The same is true of whiffs, although the rise doesn’t happen until the very end of the season, as teams begin managing their bullpens like it’s the playoffs:
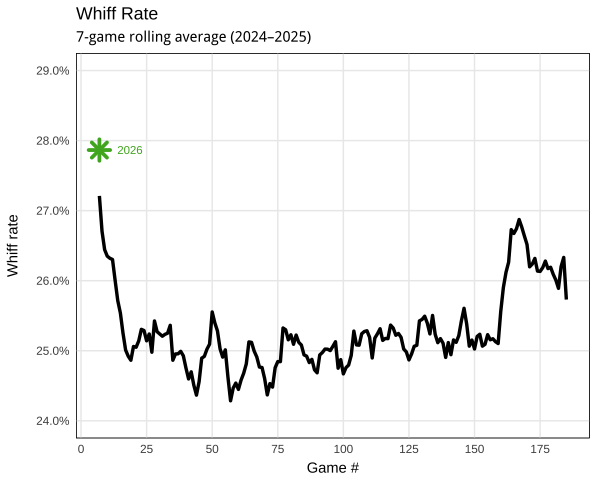
I don’t expect the current strikeout environment to hold all year, and I expect batters to slowly catch up, as they always do. That said, what we’ve seen to this point in 2026 is still quite extreme. The league’s four-seamer velocity of 94.9 mph is the highest-ever mark over any seven-day stretch. The league’s whiff rate of 27.9% is tied with the first week of 2025 for the highest ever over any seven-day stretch. The league’s strikeout rate is not quite the highest ever, but it’s very close. These figures aren’t outliers by any means and are only notable to the thousandths-place decimal, but there’s at least a bit of early signal that we haven’t found the ceiling on all this.
The first week of 2026 also represents the highest seven-day walk rate since 2009 at 9.8%. Now, it’s not that weird to see whiffs and velocity trending up, because they have been trending up for a while now. But walks? Walks aren’t trending. They’ve been pretty danged consistent at the plus-or-minus 8% for years and years. I think we’re likely to see this rate self-correct over the next few weeks:
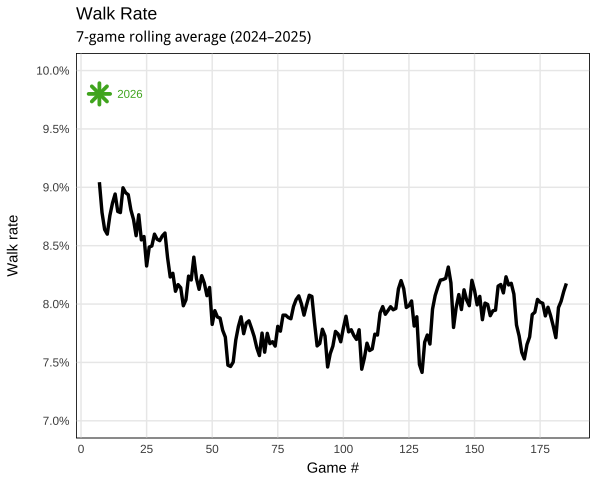
What’s interesting, however, is just how poor pitchers’ aim has been so far. More than a third of pitches have been thrown in the chase and waste regions — those regions so far out of the zone they’re rarely called strikes (0.1% in 2025). This would represent a massive increase over any other year in the pitch-tracking era. I can’t do the same weekly analysis with zone rates, and my assumption is this isn’t unheard of in small samples. But the historic rate of walks will continue until pitchers hone in, likely sooner than later.
The final truth, of course, is home runs. Unlike the stats above, home runs start low and grow throughout the season as the weather gets warm and the ball carries more:
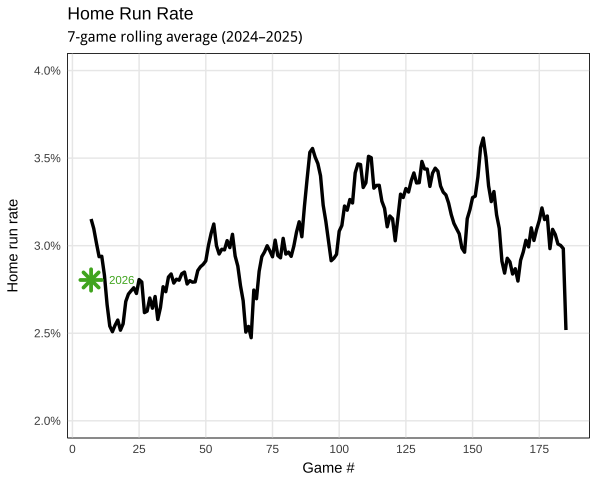
I don’t see anything notable, big or small, in the rate of plate appearances ending in a home run (2.8%), nor the rate of fly balls turning into home runs. I also don’t see evidence that the balls are juiced this year (though my only qualification to make that statement is my ability to find the drag dashboard on Baseball Savant).
That said, the league’s contact profile in the first week is interesting. While batters have shown significantly more swing-and-miss, the contact they do make is highly likely to be in the air and to the pull side. Not only that, but the barrel rate on those pulled flies is at an all-time high. I’m not sure whether that will lead to more homers as the season goes on — these rates have trended up for years, while home run rates have not. But I think this implies batters are continuing to change their approach, aiming for the shallowest part of the park and away from the historically excellent defenders in center field.
OK, to recap: 1) Strikeouts are up, and though they will probably come down, the trend is still somewhat notable; 2) walks are way up, but will probably come down, assuming pitchers can find the zone; and 3) homers are normal, even if batters seem to be trying very hard to hit them. The first week of 2026 represents the highest rate of plate appearances ending in a three true outcome since… the final week of 2025. We are, roughly, here:
The Mariners have hit many singles since those first two games. It was a bizarre feat made more likely by the current state of the majors: Guardians pitchers avoided the zone, Mariners hitters swung for the fences, and good defenders took what remained. But it should be clear that, even in a modern environment, such an event is far from the norm. There are still plenty of singles in baseball, still plenty of action. The sport is not dying. In fact, looking at the list above of players with the most three true outcomes, I kind of think we like this style of play.