
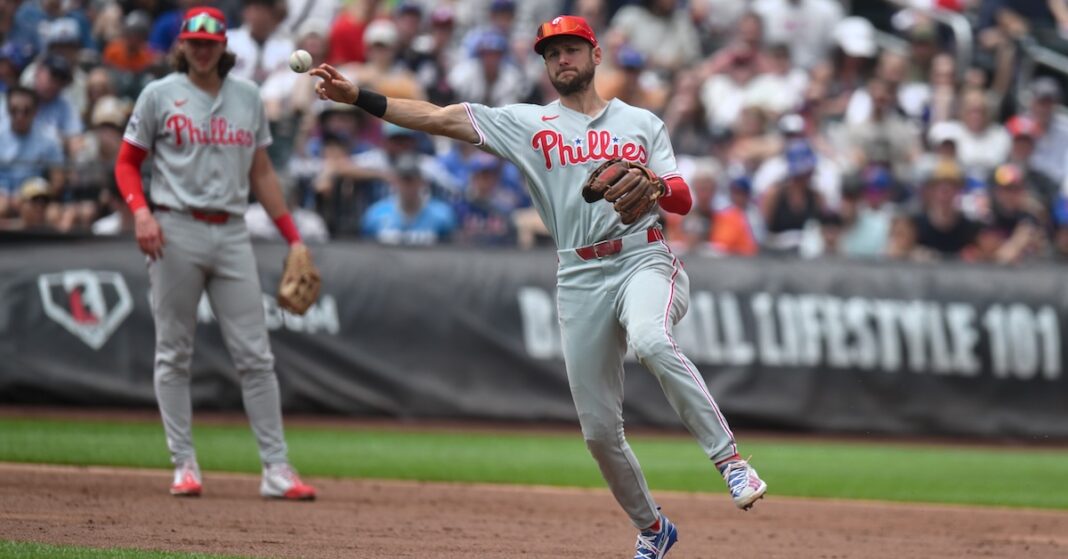

It has not been a good season for Trea Turner. The two-time batting champion is in the midst of a career-worst season at the plate, hitting for a 79 wRC+ (.239/.287/.368) even after homering in three straight games, including a three-run shot off Pirates ace Paul Skenes on Wednesday night. What’s more, after breaking a streak of three straight below-average seasons at shortstop according to both Defensive Runs Saved and Fielding Run Value last year, he’s not only back in the red, but is tied for last at the position with -8 DRS, while being tied for fifth-worst with -5 FRV. All of which once again marks Turner as a fairly typical Phillies player.
Indeed, through ups and downs that have included four postseason appearances, one trip to the World Series, and two in-season managerial firings, one constant of the Dave Dombrowski era of Phillies baseball has been lousy defense. Since the start of the 2021 season, the team is 100 runs below average according to FRV (the majors’ seventh-lowest mark) and 127 below average according to DRS (fifth-lowest). It hasn’t stopped the Phillies from being competitive — or highly entertaining — though it may have cost them seeding here and there, to say nothing of the way last year’s Division Series against the Dodgers ended. But given the choice between good hitters with questionable gloves and slick fielders with subpar bats, the team has generally gone for the offensive boost and lived or died with the consequences.
Thus it was hardly a surprise that the Phillies ranked second-to-last in my recent aggregation of team defensive metrics, even with right fielder Nick Castellanos — who contributed -41 DRS and -45 FRV from 2022–25 before being released in February — no longer on the team, and Kyle Schwarber more or less a full-time designated hitter. The Phillies’ .672 Defensive Efficiency, the rate at which a team turns batted balls into outs, is lower than all but the Rockies (.669), while their -29 DRS is lower than all but the Twins’ -32.
Again, it hasn’t stopped the Phillies from contending. After firing manager Rob Thomson following a 9-19 start, they’re now 49-38, 2 1/2 games out of first place in the NL East and tied with the Cubs for the top NL Wild Card spot. As such, they head this roundup of the worst team defenses among contenders, part of my annual midseason dip into the alphabet soup of defensive metrics, including DRS, FRV, and our own pitch-framing metric, FRM. Longtime standby Ultimate Zone Rating has been retired, so it’s no longer part of my methodology.
To recap, on an individual level, even a full season of data isn’t enough to get the clearest picture of a player’s defense, so it’s not surprising that samples of 700 innings or fewer produce divergent values across the major metrics; different methodologies produce varying spreads in runs from top to bottom, spreads that owe something to what they don’t measure, as well as how much regression is built into their systems. Pitchers don’t have FRV values, DRS tends to produce more extreme ratings (positive and negative) than Statcast, and every single-season metric implicitly bears the fine print of a sample size caveat. But within this aggregation, I believe we get enough signal at this point in the season to justify checking in. I don’t proclaim this to be a bulletproof methodology so much as a good point of entry into a broad topic.
To account for all the bits in the alphabet soup, I aggregated the aforementioned metrics, adjusting for the varying spreads in run values by using z-scores, which measure how many standard deviations each team is from the league average in each category. As with the past two seasons, I’ve broken out catcher values for both FRV and DRS from the rest of a team’s values in both metrics. Note that the version of DRS that we display on FanGraphs now includes a framing component (rSZ, for strike zone) that isn’t used in Baseball Reference’s WAR calculations (though you can find it in the Sabermetric Fielding section on a player’s fielding page). The three catcher measures (including FRV) are each weighted at one-half the value of the non-catcher scores, which improves the overall z-score formula’s correlation with run prevention. Last year, I began adding Defensive Efficiency — the rate at which a team turns batted balls into outs, published at Baseball Reference — to the mix as well. I originally weighted that equally with non-catcher DRS and FRV, but found that weighting it at 1.5 times improved the correlation with run prevention. In 2024, before I added Defensive Efficiency, the midseason z-score formula had a -.39 correlation with runs allowed per game (higher scores mean fewer runs allowed), but with the reconfigured formula, this year’s correlation has improved to -.60.
You Aren’t a FanGraphs Member
It looks like you aren’t yet a FanGraphs Member (or aren’t logged in). We aren’t mad, just disappointed.
We get it. You want to read this article. But before we let you get back to it, we’d like to point out a few of the good reasons why you should become a Member.
1. Ad Free viewing! We won’t bug you with this ad, or any other.
2. Unlimited articles! Non-Members only get to read 10 free articles a month. Members never get cut off.
3. Dark mode and Classic mode!
4. Custom player page dashboards! Choose the player cards you want, in the order you want them.
5. One-click data exports! Export our projections and leaderboards for your personal projects.
6. Remove the photos on the home page! (Honestly, this doesn’t sound so great to us, but some people wanted it, and we like to give our Members what they want.)
7. Even more Steamer projections! We have handedness, percentile, and context neutral projections available for Members only.
8. Get FanGraphs Walk-Off, a customized year end review! Find out exactly how you used FanGraphs this year, and how that compares to other Members. Don’t be a victim of FOMO.
9. A weekly mailbag column, exclusively for Members.
10. Help support FanGraphs and our entire staff! Our Members provide us with critical resources to improve the site and deliver new features!
We hope you’ll consider a Membership today, for yourself or as a gift! And we realize this has been an awfully long sales pitch, so we’ve also removed all the other ads in this article. We didn’t want to overdo it.
Here are the spreads for the various categories, updated with data through June 30:
Team Defense Metrics Ranges
| Metric | Split | Max | Min | StDev |
|---|---|---|---|---|
| DRS_non-C | Non-Catchers | 58 | -32 | 21.8 |
| DRS_C | Catchers | 13 | -8 | 4.7 |
| FRV_non-C | Non-Catchers | 39 | -20 | 14.6 |
| FRV_C | Catchers | 16 | -11 | 5.9 |
| FRM | Catchers | 6.7 | -5.7 | 3.1 |
| Def Eff | — | .734 | .669 | .014 |
Statistics through June 30.
And here are the full rankings, also updated and thus ever so slightly different from what ran on Tuesday:
Team Defense Standard Deviation Scores
| Team | DRSnonC-z | DRSC-Z | FRVnonC-Z | FRVC-z | FRM-z | DefEff-z | Tot |
|---|---|---|---|---|---|---|---|
| Rockies | 0.00 | -0.59 | -0.05 | -1.15 | -0.81 | -2.39 | -4.92 |
| Phillies | -1.97 | 1.13 | -1.36 | 1.55 | 0.83 | -1.97 | -4.53 |
| Twins | -1.79 | -0.80 | -1.08 | -0.65 | 1.09 | -0.84 | -4.32 |
| Athletics | -1.10 | 0.27 | -1.01 | -0.48 | -1.30 | -0.91 | -4.24 |
| Angels | -0.28 | -1.66 | -0.95 | -1.83 | -1.36 | -0.28 | -4.07 |
| Mariners | -0.46 | -1.02 | -1.43 | -0.31 | 0.41 | -0.49 | -3.08 |
| Reds | -1.19 | -0.80 | -0.46 | -0.14 | -1.81 | 0.07 | -2.93 |
| Pirates | -0.14 | -0.37 | -0.88 | -0.31 | -0.59 | -0.70 | -2.70 |
| Orioles | -0.37 | 0.92 | -0.81 | 1.21 | -0.30 | -0.98 | -1.74 |
| Royals | -0.55 | 0.06 | 0.29 | -0.82 | 0.35 | -0.70 | -1.52 |
| White Sox | 0.04 | -1.66 | 0.50 | -0.82 | -0.42 | 0.28 | -0.49 |
| Mets | 0.27 | 0.92 | -1.22 | 0.53 | 0.87 | -0.21 | -0.11 |
| Guardians | 0.27 | -0.37 | 0.57 | -0.48 | -0.26 | -0.14 | 0.07 |
| Rangers | 0.23 | 0.06 | 0.22 | -0.65 | -1.62 | 0.56 | 0.19 |
| Brewers | 0.82 | -1.23 | -0.12 | -0.82 | -0.78 | 0.70 | 0.34 |
| Giants | 0.32 | 0.49 | -0.40 | 1.04 | 0.90 | -0.42 | 0.50 |
| Astros | 0.46 | -0.16 | 0.29 | -0.65 | -1.01 | 0.49 | 0.58 |
| Nationals | -0.37 | 0.70 | 0.02 | 1.21 | 1.67 | -0.56 | 0.60 |
| Marlins | -0.69 | 0.27 | -0.05 | -0.31 | 0.61 | 0.70 | 0.60 |
| Tigers | -1.15 | 0.92 | -0.95 | 1.38 | 1.61 | 0.56 | 0.70 |
| Cardinals | 0.55 | -1.23 | 1.25 | 0.37 | 0.45 | -0.28 | 1.17 |
| Rays | 1.28 | -0.80 | -0.53 | -0.65 | -0.20 | 1.27 | 1.82 |
| Yankees | -0.64 | 1.13 | -0.12 | 1.21 | 1.03 | 0.63 | 1.87 |
| Padres | -0.18 | 1.56 | 1.25 | 0.37 | -0.10 | 0.00 | 1.98 |
| Blue Jays | -0.69 | 2.85 | -0.40 | 2.73 | 2.12 | -0.49 | 2.03 |
| Red Sox | 1.42 | 0.06 | 1.18 | 0.37 | 0.09 | -0.14 | 2.65 |
| Braves | 0.87 | -0.16 | 0.50 | -0.48 | 0.38 | 1.34 | 3.24 |
| Diamondbacks | 0.73 | -0.59 | 1.46 | 0.37 | -0.59 | 1.13 | 3.47 |
| Dodgers | 2.15 | 0.06 | 1.66 | -0.82 | -0.72 | 2.25 | 6.45 |
| Cubs | 2.15 | 0.06 | 2.63 | -0.98 | -0.55 | 1.62 | 6.46 |
All statistics through June 30. Yellow = Top-three ranking in category (including ties). Blue = Bottom-three ranking in category (including ties).
The Cubs have slipped past the Dodgers for the top spot, and the Blue Jays have surpassed the Padres for the no. 6 ranking, but what follows here is a look at the teams towards the other end of the spectrum, highlighting the worst defenses among contenders, and in particular their trouble spots. Normally I prefer to define contenders as teams playing at .500 or better, but with just six teams meeting that threshold in the American League, I’ve instead used 15% in our Playoff Odds as the cutoff. Last year, I timed this look so that it wasn’t far off from the July 31 trade deadline, but this time around we’re running the piece in closer proximity to its companion. Still, it’s worth thinking about as something of a deadline preview, particularly as defensive upgrades come more cheaply than offensive ones.
Phillies
Turner has plenty of company near the bottom of the positional rankings, even if the metrics don’t always agree. Bryce Harper is tied for last among first basemen with -7 FRV — making him the majors’ least-valuable defender once positional adjustments are thrown in — though he rates as average by DRS. On the other hand, Bryson Stott is tied for last among second basemen with -8 DRS, though he rates as one run above average via FRV. Both he and third baseman Alec Bohm (-4 DRS, -3 FRV) are nonetheless still in the running to start the upcoming All-Star Game. Like Bohm, center fielder Justin Crawford (-5 DRS, -1 FRV) rates as subpar by both metrics.
Only three Phillies are more than two runs above average by either DRS or FRV. Derek Hill has 4 DRS in just 36 innings in center field since being acquired from the White Sox earlier this month, and 5 DRS (and 2 FRV) in 94 innings there overall. The timing of his arrival coincided with the loss of right fielder Adolis García, who provided a significant upgrade over the departed Castellanos in right field, with 5 FRV and 0 DRS before a torn latissimus dorsi ended his season.
The other outlier is catcher Rafael Marchán, a 27-year-old backstop who has hit like a pitcher (.115/.148/.192, -12 wRC+) in 27 games while serving as J.T. Realmuto’s backup. In that narrow wedge of time, Marchán has accrued 6 FRV, 5 DRS, and 2.9 FRM, giving the Phillies something to show for the days on which Realmuto — who himself has been within a run or two of average in either direction — takes a breather.
Twins
Folks, is it good when all of your starting infielders are in the midst of midseason position changes? That appears to be the case for the Twins. At 42-46, 4 1/2 games out of first in the AL Central and 2 1/2 back in the Wild Card race, they’re admittedly rather fringy in terms of this contender business, but they do have 27.4% playoff odds, so they’re here, and they’re scrambling to improve.
Their infield defense is a major problem, ranking 28th in both DRS (-18) and FRV (-14), with shortstop in particular a black hole; their major league-worst -16 DRS at the position equals that of the two 29th-ranked teams, the Red Sox and Phillies (both -8). They began the season with Brooks Lee playing regularly there before moving him to third base once Royce Lewis was optioned to Triple-A St. Paul after returning from a hamate fracture left knee sprain. Lee was dreadful at short (-7 DRS, -4 FRV in 390 innings), but since then, Tristan Gray, who has gotten most of the playing time at the position, has been even worse on a rate basis (-8 DRS, -7 FRV in just 227 innings); Ryan Kreidler and Orlando Arcia, who have been in the mix with a combined 159.1 innings, have been more or less average. Lee hasn’t been quite as bad at third (-3 DRS and -2 FRV in 319.1 innings), but that’s not to say he’s been good. Since returning from Triple-A, Lewis has been playing first base, where he’s fine defensively but digging a hole offensively, as he hasn’t been able to rediscover his stroke and has just an 85 wRC+ since the start of last season.
Meanwhile, in addition to his falling off from a 134 wRC+ in his 49-game rookie season last year to an 89 wRC+ this year, Luke Keaschall has been so rough at second base (-6 DRS, -5 FRV) that the Twins are working with him to learn first base and right field — he debuted at the latter position last Friday — and have been playing Kody Clemens, who spent most of the first two months of the season at first, at the keystone.
The Twins’ troubles don’t end there. Matt Wallner’s early-season offensive troubles forced him back to Triple-A in mid-May, but he did a fair bit of damage in right field (-8 DRS, -5 FRV) before going. Austin Martin has been an upgrade there (5 DRS, 1 FRV), though he lacks Wallner’s offensive upside. Trevor Larnach has been nothing special in left (-3 DRS, -2 FRV), though at least his offense justifies his spot in the lineup. Behind the plate, DRS doesn’t like starter Victor Caratini (-4), but other metrics at least value his framing as above average; with Ryan Jeffers out since mid-May due to a fractured left hamate, backup Alex Jackson has been in the red in all three metrics, including -3 FRV in just 116 innings.
Athletics
To an even greater degree than the Twins, the A’s are on the outskirts of contending; with a 41-46 record, they’re three games out in both the AL West and Wild Card races, with playoff odds of 18.2%. While they have one of the youngest lineups in the league and a handful of exciting players, defense isn’t necessarily their forte, though the worst that can be said for shortstop Jacob Wilson (-5 DRS, 5 FRV), left fielder Tyler Soderstrom (6 DRS, -3 FRV), and first baseman Nick Kurtz (5 DRS, -2 FRV) is that the metrics give them mixed reviews. The same is true to some degree for Shea Langeliers, who leads the AL All-Star voting at catcher thanks to his offensive prowess. The metrics are down on his pitch framing; he not only has -4.2 FRM but is four runs below average in Statcast’s framing component and five below average in that of DRS, though in both metrics, his throwing and blocking offset that to some degree.
Elsewhere, Max Muncy can’t hold a candle to his Dodgers counterpart; while he’s played just 342.2 innings at third base, both his -11 DRS and -6 FRV rank last at the position. Zack Gelof has been much better at the spot (6 DRS, 1 FRV), but he’s currently on the IL due to a right hand contusion. Lawrence Butler has been a disappointment on both sides of the ball, including -5 DRS and -6 FRV split between center field and right. Right fielders Carlos Cortes and Colby Thomas have combined for -6 DRS and -8 FRV in less than 400 innings, but rookie Henry Bolte, who has gotten the bulk of the center field duty since being called up in mid-May, has provided an upgrade in the middle pasture (2 DRS, 3 FRV).
Mariners
There haven’t been many positives on the defensive side of things for the Mariners this season. Even with Cole Young’s work at second base (10 DRS, 2 FRV), their infield ranks 20th in DRS (-5) and 25th in FRV (-11). Josh Naylor’s metrics offer mixed reviews at first base (-6 DRS, 0 FRV), but the bigger problem is on the left side of the infield. Brendan Donovan is currently in the midst of his second trip to the injured list for a recurrent groin strain, and between his struggles and those of his teammates, Mariners third baseman have compiled -5 DRS and -7 FRV. The arrival of rookie Colt Emerson has stabilized the shortstop position, where J.P. Crawford had struggled (-6 DRS, -6 FRV), but the latter has been been roughly average at third.
Outfield defense has been an issue as well, as the team’s -10 FRV is the majors’ third-lowest, with Luke Raley accounting for half of that deficit (and also -6 DRS) in just 437.1 innings. Julio Rodríguez has been merely average by both metrics after putting up 9 DRS and 10 FRV last year, but he’s at least trending upward; as Ryan Blake noted when he checked in on Rodríguez at Lookout Landing in early June, his -4 Outs Above Average ranked last among center field qualifiers, largely the result of misses on one- and two-star plays.
The team has also felt the absence of Cal Raleigh, and not just because he’s scarcely resembled the slugger who hit 60 homers last season. The 2024 Gold Glove winner missed a month due to an oblique strain; he’s been slightly above average when he’s played, but backup Mitch Garver has been subpar (-5 DRS, -1.4 FRM, -2 FRV).
Pirates
In the aggregate, Pittsburgh’s infield has been average by both metrics, but there’s a fair bit of variance around the dirt. Second baseman Brandon Lowe has been stellar (7 DRS, 5 FRV), while shortstop Konnor Griffin has produced mixed metrics (1 DRS, -4 FRV), with first baseman Spencer Horwitz (-4 DRS, -1 FRV) and third baseman Nick Gonzales (-8 DRS,-3 FRV) in the red in both. Utilityman Jared Triolo, who covered shortstop before Griffin was called up and during his four-week absence due to a flexor strain, has been right around average both there and in spot duty at the infield corners.
The outfield has been a bigger problem, with the team ranking among the bottom six in both DRS (-15) and FRV (-12). Oneil Cruz is tied for the lowest DRS among center fielders (-10) despite being out since June 7 due to non-displaced fractures in his fourth and fifth metacarpals in his left hand; he has -2 FRV as well. Fill-in Jake Mangum has been average there, but Ryan O’Hearn has been rough in right (-5 DRS, -4 FRV). Left fielder Bryan Reynolds has garnered mixed reviews (3 DRS, -2 FRV).
Orioles
I originally had the White Sox in the sixth spot here, mainly over catching issues that appeared to come out in the wash after Edgar Quero was optioned upon the return of Kyle Teel from the IL. But with the playoff odds of the A’s and Orioles (40-48, 17.5%) converging, I’m instead including Baltimore here.
The Orioles’ catching tandem of Adley Rutschman and Samuel Basallo is a strength, with Rutschman even tied for the lead among all catchers with 9 FRV. On the other hand, their infield and outfield both rank within the majors’ bottom third on an aggregated basis, which helps to explain why they’ve got the majors’ third-lowest Defensive Efficiency (.688).
Most of their problems come down to two trouble spots: third base and center field. At the hot corner, the’ve got the majors’ lowest DRS (-10) and FRV (-7, tied with the Mariners), with Coby Mayo (-8 DRS, -4 FRV in just 398.2 innings) living up to defense that drew a 30 grade when he was a prospect. Over the past three weeks, he’s been more or less displaced by Blaze Alexander, who has been solid there and at four of the other five positions at which he’s spotted. Center field is the exception; Alexander somehow has -4 DRS and -3 FRV in just 42 innings worth of cameos there. Leody Taveras has spent the most time in center field (469.1 innings), though he’s struggled (-4 DRS, -2 FRV); lately he’s been in the right field mix while Colton Cowser has covered center with considerably more success (3 DRS, 2 FRV), including home run robberies on back-to-back days on Sunday and Monday. Beyond those two spots, the metrics of Jackson Holliday (-3 DRS, -1 FRV in 262. innings) bear watching, especially because he was rather lousy at second base last season (-10 DRS, -6 FRV).
Particularly in cases where the aforementioned players are struggling at the plate as well, there’s a good chance some of these defensive issues will be revisited during All-Star week, when I dig into my annual Replacement Level Killers series. Stay tuned.