

As is tradition at FanGraphs, we’re using the lead-up to the trade deadline to take stock of the top 50 players in baseball by trade value. For a more detailed introduction to this year’s exercise, as well as a look at the players who fell just short of the top 50, be sure to read the Introduction and Honorable Mentions piece, which can be found in the widget above.
For those of you who have been reading the Trade Value Series the last few seasons, the format should look familiar. For every player, you’ll see a table with the player’s projected five-year WAR from 2027-2031, courtesy of Dan Szymborski’s ZiPS projections. The table will also include the player’s guaranteed money (exclusive of any signing bonus), if any, the year through which their team has contractual control of them, last year’s rank (if applicable), and then projections, contract status, and age for each individual season through 2031 (assuming the player is under contract or team control for those seasons, or has a player or vesting option). Last year’s rank includes a link to the relevant 2025 post. Thanks are due to Sean Dolinar for his technical wizardry. At the bottom of the page, there is a grid showing all of the players who have been ranked up to this point.
A note on these rankings: As we ascend towards the top of the list, the tiers and my explanation of them become increasingly important. Don’t get too hung up on what number a player is, because who they’re grouped with is a more telling indicator of what I think of them. As I mentioned yesterday, there’s a long run of players with similar trade value extending from spots 35 to 23, with the gap between the players ranked 23rd and 19th larger than the gap between those ranked 35th and 23rd. Team-specific roster needs, budgets, and competitive windows could significantly affect how clubs might order this group. I’ll note places where I disagreed meaningfully with the people I spoke with in calibrating this list, and I’ll also note the players whose value my contacts disagreed about. As I mentioned in the Introduction and Honorable Mentions piece, I’ll indicate tier breaks between players where appropriate, both in their capsules and bolded in the table at the end of the piece.
With that out of the way, let’s get to the next batch of players.
| Five-Year WAR | 15.5 |
| Guaranteed Dollars | – |
| Team Control Through | 2030 |
| Previous Rank | HM |
| 2027 | 28 | 3.7 | PRE-ARB |
| 2028 | 29 | 3.5 | ARB 1 |
| 2029 | 30 | 3.1 | ARB 2 |
| 2030 | 31 | 2.9 | ARB 3 |
You Aren’t a FanGraphs Member
It looks like you aren’t yet a FanGraphs Member (or aren’t logged in). We aren’t mad, just disappointed.
We get it. You want to read this article. But before we let you get back to it, we’d like to point out a few of the good reasons why you should become a Member.
1. Ad Free viewing! We won’t bug you with this ad, or any other.
2. Unlimited articles! Non-Members only get to read 10 free articles a month. Members never get cut off.
3. Dark mode and Classic mode!
4. Custom player page dashboards! Choose the player cards you want, in the order you want them.
5. One-click data exports! Export our projections and leaderboards for your personal projects.
6. Remove the photos on the home page! (Honestly, this doesn’t sound so great to us, but some people wanted it, and we like to give our Members what they want.)
7. Even more Steamer projections! We have handedness, percentile, and context neutral projections available for Members only.
8. Get FanGraphs Walk-Off, a customized year end review! Find out exactly how you used FanGraphs this year, and how that compares to other Members. Don’t be a victim of FOMO.
9. A weekly mailbag column, exclusively for Members.
10. Help support FanGraphs and our entire staff! Our Members provide us with critical resources to improve the site and deliver new features!
We hope you’ll consider a Membership today, for yourself or as a gift! And we realize this has been an awfully long sales pitch, so we’ve also removed all the other ads in this article. We didn’t want to overdo it.
Dingler’s offensive breakout this season comes down to his straightforward approach: He wants to make contact and get the ball in the air. It’s probably not going to result in a 135 wRC+ all that often, but to my eyes, the floor of this strategy is extremely high. He also doesn’t strike out that much, and he swings hard enough that his contact quality is well above the slap-hitting area that sometimes snares high-contact types.
All that, he won’t reach arbitration until 2028, and he’s still only 30th? The good news is that this is the last time I’ll talk about how I have catchers shaded much lower on my value hierarchy this year. It’s no knock on Dingler, who most of the people I talked to agreed should be the top catcher on this list. If you value that more than I do, I could see him slotting in as high as 20th. It’s just hard to value the far-off years of team control when catchers don’t tend to stay on top for very long. If I were a team trading for Dingler, I’d be doing it with my eyes on 2026, 2027, and mayyyyyybe 2028. Those years project to be very good, and very good at a position where replacement-level offense can be disastrously low. That sounds like a lot of trade value to me – just not as much as the next 29 dudes.
| Five-Year WAR | 19.0 |
| Guaranteed Dollars | $124.0M |
| Team Control Through | 2035 |
| Previous Rank | #11 |
| 2027 | 24 | 3.5 | $6.0M |
| 2028 | 25 | 3.8 | $8.0M |
| 2029 | 26 | 3.9 | $10.0M |
| 2030 | 27 | 4.0 | $20.0M |
| 2031 | 28 | 3.8 | $20.0M |
Three years in, I’m quite sure that Merrill is a very good center fielder. He’s fast, he takes good routes, and he has a strong throwing arm. He’s always been a very good baserunner, and he’s on track to more than double his career high in steals this year. That’s great. His defense was an open question when he switched from shortstop to center field to avoid an infield logjam and make his debut in 2024, but that question is now settled.
Instead, the one thing Merrill is struggling with is the thing most people thought he’d be best at. Now, there are plenty of good-glove/bad-hit center fielders, but most of them didn’t get 70 hit tool grades as prospects. Analysts everywhere comped Merrill to Michael Brantley and projected high batting averages and decent power in the future, and his rookie season went exactly that way. But he’s an aggressive swinger, and the past two years have shown that his natural bat-to-ball skills can’t outrun the deleterious effects of swinging at terrible pitches.
I’m certain that the feel to hit is still in there somewhere. You can see it in how Merrill is struggling; he’s coming up empty too often when he swings and is chasing the wrong pitches, but he still manages solid hard-hit and barrel rates because he has a knack for moving his bat around the zone while maintaining his swing. The problem is that he’s just not doing it often enough. He takes too many swings at bad pitches, and a lot of his hardest contact goes to center field, where it’s hard to leave the yard. That’s acceptable when you’re putting a ton of balls in play and raking line drives, but he’s not doing either of those things this year.
In some ways, Merrill’s situation is an echo of teammate Fernando Tatis Jr. If he rebounds to hit like he did in the first two years of his career, his deal is an incredible bargain. ZiPS is still a believer; plug in its projections and my accounting of the cost of a win, and Merrill is in the top 10 in surplus value. But I’m a lot more scared than that forecast would imply, and the downside of this deal is nothing to sneeze at. It’s a lot of years and a lot of money if he’s just a great glove with a meh bat. That dropped him to the bottom of this tier for me.
| Five-Year WAR | 18.0 |
| Guaranteed Dollars | – |
| Team Control Through | 2030 |
| Previous Rank | HM |
| 2027 | 26 | 3.6 | ARB 1 |
| 2028 | 27 | 3.8 | ARB 2 |
| 2029 | 28 | 3.8 | ARB 3 |
| 2030 | 29 | 3.5 | ARB 4 |
If you had Pages making more contact than Merrill when they both debuted in 2024, you’re probably a time-traveling wizard. But that’s exactly what has happened. Pages has borderline elite zone contact skills, and since he swings fairly hard and hits the ball in the air a lot, he’s an amazing fit for the cozy left field at Dodger Stadium. He’s hit 17 homers this year, sixteen of which have gone out to left.
I’m not buying this year’s improved walk rate, because I think it’s part of a cat-and-mouse game with pitchers. Pages is swinging meaningfully less in 2026, particularly at pitches in the strike zone, and pitchers haven’t adjusted yet. He still wants to swing, and for me, it’s just a matter of time before that evens out. Even so, this is a pretty good skill set: great defense, solid hitting, and a consistent track record of improvement. I sandwiched Pages between two center fielders with similar defensive skill sets. There weren’t many people who told me they’d move him out of that trio, but I think he’s probably the safest of the group. I just like the upside of the next guy a little bit more.
| Five-Year WAR | 18.9 |
| Guaranteed Dollars | $44.0M |
| Team Control Through | 2032 |
| Previous Rank | #50 |
| 2027 | 26 | 3.8 | $3.5M |
| 2028 | 27 | 3.9 | $5.5M |
| 2029 | 28 | 3.9 | $7.5M |
| 2030 | 29 | 3.7 | $10.5M |
| 2031 | 30 | 3.5 | $13.0M |
Offensively, well, Rafaela does enough to make the defense sing. He chases a lot. I don’t think that there’s much chance at all of him turning into a true-talent good hitter. His voracious appetite and sneaky-good contact skills mean that he rips off some impressive hot streaks, but a second-percentile chase rate and middling bat speed are a tough combination to overcome. If you play Rafaela, you’re accepting that there will be long stretches of him rarely reaching base mixed in with the web gems, and you’re hoping that his offense will end up right around league average at year’s end. To be fair, if it does, he’s probably an All-Star, because league average hitting and his defense works out to something in the neighborhood of 4.5 WAR in a full season of playing time.
Teams don’t pay as much for one win’s worth of defense as they do for one win’s worth of offense. I generally got feedback that all three of these players are lower on team boards than they are on mine (to the extent that teams have “trade value” boards, which is probably not that much). I’m also discounting defensive value, but clearly by less than the industry. And I think that Rafaela’s combination of a truly transcendent glove and a good contract (around $8 million a year for the next five years, plus a team option) puts him ahead of the other two guys with at least similar skill sets. Just know that I’m not 100% in alignment with a bunch of people I trust on this one.
| Five-Year WAR | 18.0 |
| Guaranteed Dollars | – |
| Team Control Through | 2031 |
| Previous Rank | – |
| 2027 | 25 | 3.1 | PRE-ARB |
| 2028 | 26 | 3.5 | PRE-ARB |
| 2029 | 27 | 3.8 | ARB 1 |
| 2030 | 28 | 3.9 | ARB 2 |
| 2031 | 29 | 3.6 | ARB 3 |
He has a huge, powerful swing that comes with the kind of swing-and-miss you’d expect. His 66% contact rate is one of the lowest in the majors, but that’s part of the plan. He’s taking huge hacks and trying to get the ball in the air. He has a 20.5% HR/FB rate that looks about right given how loud his best contact is, and only two batters hit fly balls more frequently. Sure, it’s a one-dimensional approach, but power is the best dimension if you’re only going to pick one. Montgomery even has a reasonable sense of the strike zone. He swings slightly more than I’d prefer given his overall profile, but it’s still well below my threshold for being worried that he’ll just get junkballed to death by pitchers.
I suppose I’m worried about what would happen if Montgomery lost some bat speed, but for whatever reason, I find myself focusing on the upside if he can curtail his strikeouts even a little bit instead. It sounds weird, but I think that hitters who can sustain a good batting line while striking out that often have enormous upside if they put something together later. If you can succeed despite what should be a disqualifying flaw, imagine what you might do after that flaw goes away. It’s a risky profile, for sure – what if Montgomery starts striking out more? – but particularly for a cost-controlled guy with defensive value, it’s a bet I really want to take.
Speaking of defensive value, the broad consensus is that Montgomery is not as good of a defender as FRV makes him out to be. Some people have him as a long-term third baseman, while others have him as a range-limited shortstop who makes up for it with great body control and a big arm. I tend to side with the second view, but I do agree that he’s probably not an elite defender.
I guess I just like this confluence of skills – shortstop-capable, massive power – more than the people I talked to. I had Montgomery even higher than this at the start of my cross-checking, and this is still an aggressive ranking relative to the feedback I got. I just like the bet on getting enough offense and enough defense to have a really nice player for a long time – and ZiPS generally agrees, for what it’s worth.
| Five-Year WAR | 19.1 |
| Guaranteed Dollars | – |
| Team Control Through | 2028 |
| Previous Rank | #7 |
| 2027 | 26 | 4.0 | ARB 2 |
| 2028 | 27 | 3.9 | ARB 3 |
Having said that, we should talk about the flaws, because there are two big ones, and they led to me moving Henderson down throughout the evaluation process despite better projections than plenty of players you’ll see ahead of him in this ranking. First, he’s in the middle of his worst season in the majors. It’s not an awful showing by any means, which is part of why both my rankings and the industry in general tend to like offensively-minded players at premium defensive positions. We’re projecting Henderson to finish the year with roughly 4 WAR despite a 94 wRC+ so far. Some of that is that his long track record of offensive success has our models bullish on his second half, but some of it is just that average defense at a tough position as your downside case is very valuable if you can hit a little.
Henderson is scuffling at the plate in pretty much every way this year: slower swing speed (still very fast, but notably slower), more chase, and fewer line drives and barrels. ZiPS has lowered its estimation of his offense as a result. But it still thinks he’s a very good hitter, and this is basically what projection systems are for: taking a guy having a bad half and forecasting whether it’s a sea change or a rough patch.
The other flaw is that you only get two more years of Henderson after this one. Those project to be very valuable years; he’s a big surplus value bargain even now. But there are few players in the upper reaches of this list with this little time left before free agency. There’s only one more, in fact, and Henderson is clearly worse than him, both to me and to the people I talked to.
I get it. You look at the 2026 batting line, and it’s bad. But I got less pushback on having Henderson here than I did on the four other guys in this group. Scouting types are believers in Henderson’s skill set and so are model types, because what can I say? The models like him. They’re all about looking through small-sample performance and focusing on the future. I’m sure that folks are going to be howling in the comments about this one. But hey, it’s not your list. It’s mine, I think Gunnar Henderson is really good, and I think that he’s good enough and cheap enough for the rest of his team control that I’d be interested in trading a bundle to get him. In fact, that’s how I feel about everyone in this tier. If you want to label one group on this list as “Ben’s Guys,” this is the one. There’s something I value very highly in each of these players, plus some flaws that I’m willing to live with, even if those imperfections are enough to push them below some true standouts we’ll see later on.
| Five-Year WAR | 14.4 |
| Guaranteed Dollars | – |
| Team Control Through | 2029 |
| Previous Rank | #34 |
| 2027 | 27 | 3.2 | ARB 1 |
| 2028 | 28 | 3.1 | ARB 2 |
| 2029 | 29 | 2.9 | ARB 3 |
I’m a sucker for pitchers with great fastball command, and Woo is an archetypical example. Despite roughly average velocity, he attacks righties with a four-seamer/sinker mix, and then spins gyro and sweeping sliders off of that. He’s not quite as good against lefties, but his four-seamer/gyro/changeup mix there is a nice one nonetheless. I’m also into pitchers who blend an attack-the-zone mindset with enough command to avoid just lobbing in meatballs that get clobbered, and while the cavernous confines of T-Mobile Park flatter Woo’s numbers somewhat, he’s downright surgical with his locations in a way that’s easier to catch by watching a game than by looking at the metrics.
Woo makes a lot of starts. He’s capable of going deep into games thanks to an economical pitch count. He looks like a true contact quality limiter to me; he gets a lot of weak pop-ups and a lot of weak grounders. Pitch-level models really like Woo’s stuff despite the forgettable velocity, and I round up for that profile because I believe it’s marginally less likely to lead to injury. I don’t care much about his poor ERA this year; every other run prevention estimator loves what he’s doing, he’s just been victimized by a minuscule strand rate.
The argument against Woo is that he’s only around for three more years after this one. But uh, that’s a lot of years of a cheap and very good arm. Would I be happy with Bryan Woo as the best arm in my postseason rotation? No, but that’s because if I ran a team, I’d be trying really hard to get one of the seven (and a half) pitchers ahead of him on this list. If you’re looking for a combination of good track record, good current form, high floor, and a good contract situation, Woo checks the box better than anyone outside the top 15. That’s how I ended up placing him here.
| Five-Year WAR | 11.9 |
| Guaranteed Dollars | – |
| Team Control Through | 2031 |
| Previous Rank | – |
| 2027 | 25 | 2.6 | PRE-ARB |
| 2028 | 26 | 2.5 | PRE-ARB |
| 2029 | 27 | 2.4 | ARB 1 |
| 2030 | 28 | 2.3 | ARB 2 |
| 2031 | 29 | 2.2 | ARB 3 |
He does miss sometimes – he has roughly average command per our models, and the eye test and his scouting grades agree – which leads to a slightly elevated walk rate. But that’s not a huge deal, because it’s very difficult to take McLean for extra bases. His sinker is really hard to lift, while his secondaries are hard to even make contact with. In other words, you might see a little more traffic on the bases with McLean than you’re used to with a great starter, but it all works out similarly in the end, because groundball singles and walks aren’t a reliable way to put together offense.
The main downsides here are inextricable from his profile. Sinker-dominant guys struggle to run up huge strikeout numbers because their best pitch leads to a ton of contact. McLean has a below-average swinging strike rate despite all the great weapons, and though he gets to a solid strikeout rate anyway thanks to all those called strikes, I don’t see as much strikeout upside as I do for the few arms I rate ahead of him. I’m also predisposed to go for command-over-stuff types as a tiebreaker, and while McLean’s stuff is truly ludicrous, we’re well into the nitpicking flaws portion of the list at this point.
This guy could be one of the best pitchers in baseball over the next five years, and he’ll be under team control for that whole span. I’m definitely not confident that I’m right for not having McLean five or so spots higher. I just see enough risks relative to some similar arms to have him lower on the list. And if I were contending right now, I’d just barely prefer the three guys in the next tier, too.
| Five-Year WAR | 16.9 |
| Guaranteed Dollars | $200.0M |
| Team Control Through | 2031 |
| Previous Rank | #8 |
| 2027 | 35 | 5.8 | $40.0M |
| 2028 | 36 | 4.4 | $40.0M |
| 2029 | 37 | 3.2 | $40.0M |
| 2030 | 38 | 2.2 | $40.0M |
| 2031 | 39 | 1.4 | $40.0M |
Aaron Judge is the best hitter in baseball. That’s what you’re signing up for when you trade for him. He’s making $40 million a year, but so what? A surplus value model would have him far higher than that. He’s posted a 199 wRC+ for the last five years combined. That’s silly stuff. His injury-related decline this year is scary, but scary is relative; he underperformed his expected statistics by a mile and played through pain for a bit, and yet he’s posted a 149 wRC+ and clobbered 17 homers in just 59 games.
Of course, I don’t think you’re here to read about the fact that Aaron Judge is good. You’re here to understand how that fits into trade value. And while plenty of teams wouldn’t even think of trading for him, he lets you add something to your lineup that you just can’t get elsewhere. There’s no close substitute for offense like this. You can’t bundle together a bunch of solid values and recreate Judge in the aggregate.
I had Judge eighth on this list last year, and his trade value is only going to decline further from here. I still have him as a positive surplus value, but we’re burning through a lot of that positive surplus, which is how these huge deals for free agents tend to go. Next year, he’ll surely be lower. The tail end of his contract, $40 million apiece for his age-38 and -39 seasons, is going to sting. If in a year’s time he hasn’t started Judging it up again (by which I mean posting batting lines that make me giggle irresponsibly), the situation on the ground will change very quickly, and he might not be a great trade chip at all.
But if you don’t think that every big-budget team in baseball would line up a stack of “good values” from their farm system to get access to the best hitter of the 21st century while he’s still at the end of his extended peak, I don’t think you’re engaging seriously with this exercise. Surplus value rocks. It’s super fun to be an armchair GM and stack up expected future savings. But it’s not the be-all, end-all, and if you want to win the World Series, having a bunch of the best players in the game is a great way to do that.
| Five-Year WAR | 17.2 |
| Guaranteed Dollars | $248.0M |
| Team Control Through | 2035 |
| Previous Rank | #37 |
| 2027 | 28 | 3.9 | $26.0M |
| 2028 | 29 | 3.7 | $26.0M |
| 2029 | 30 | 3.5 | $26.0M |
| 2030 | 31 | 3.2 | $29.0M |
| 2031 | 32 | 2.9 | $29.0M |
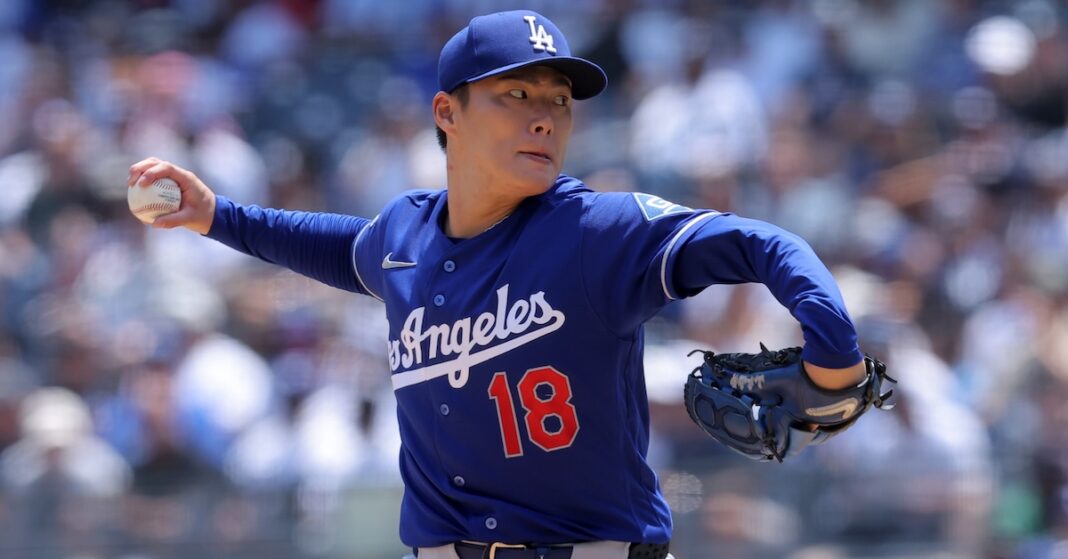
I want to emphasize how great Yamamoto has been since coming to MLB. He’s pitching at a 6 WAR/200 IP pace, and that doesn’t count his dominant 2025 postseason. He gives you both volume and per-inning excellence. He has elite command. He leads baseball in innings pitched per start this year. He has a huge arsenal and a great sense of how to mix pitches, but he’s also perfectly capable of just going fastball/splitter and mowing batters down. When you’re trading for players this good, “How helpful are they in the playoffs?” is an implied question, and we already know for sure that Yamamoto is capable of pitching in relief on short rest and just generally doing anything he can to win.
I had Yamamoto too low to start. I’m still a risk analyst at heart, even all these years into working as a baseball writer, and the asymmetric shape of the contract just gives me the ick. But I kept looking at his pitching line and moving him up, and I kept looking at other players and finding question marks. Pretty soon, I decided that even with the contract uncertainty, I couldn’t imagine preferring the pitchers I’ve already listed, even if they were a much better actuarial deal.
2026 Trade Value, 21-50
| Rank | Prev | Name | Team | Pos | 2027 | 2028 | 2029 | 2030 | 2031 |
|---|---|---|---|---|---|---|---|---|---|
| Let’s Go Win the World Series | |||||||||
| 21 | 37 | Yoshinobu Yamamoto | LAD | SP | 3.9 $26.0M |
3.7 $26.0M |
3.5 $26.0M |
3.2 $29.0M |
2.9 $29.0M |
| 22 | 8 | Aaron Judge | NYY | OF | 5.8 $40.0M |
4.4 $40.0M |
3.2 $40.0M |
2.2 $40.0M |
1.4 $40.0M |
| Great Controllable Arms | |||||||||
| 23 | – | Nolan McLean | NYM | SP | 2.6 PRE-ARB |
2.5 PRE-ARB |
2.4 ARB 1 |
2.3 ARB 2 |
2.2 ARB 3 |
| 24 | 34 | Bryan Woo | SEA | SP | 3.2 ARB 1 |
3.1 ARB 2 |
2.9 ARB 3 |
||
| Spectacular, With Flaws | |||||||||
| 25 | 7 | Gunnar Henderson | BAL | SS | 4.0 ARB 2 |
3.9 ARB 3 |
|||
| 26 | – | Colson Montgomery | CHW | SS | 3.1 PRE-ARB |
3.5 PRE-ARB |
3.8 ARB 1 |
3.9 ARB 2 |
3.6 ARB 3 |
| 27 | 50 | Ceddanne Rafaela | BOS | CF | 3.8 $3.5M |
3.9 $5.5M |
3.9 $7.5M |
3.7 $10.5M |
3.5 $13.0M |
| 28 | HM | Andy Pages | LAD | CF | 3.6 ARB 1 |
3.8 ARB 2 |
3.8 ARB 3 |
3.5 ARB 4 |
|
| 29 | 11 | Jackson Merrill | SDP | CF | 3.5 $6.0M |
3.8 $8.0M |
3.9 $10.0M |
4.0 $20.0M |
3.8 $20.0M |
| Elite Catchers | |||||||||
| 30 | HM | Dillon Dingler | DET | C | 3.7 PRE-ARB |
3.5 ARB 1 |
3.1 ARB 2 |
2.9 ARB 3 |
|
| 31 | 49 | Drake Baldwin | ATL | C | 3.6 PRE-ARB |
3.7 ARB 1 |
3.6 ARB 2 |
3.3 ARB 3 |
|
| 32 | 9 | Cal Raleigh | SEA | C | 4.5 $12.0M |
3.9 $23.0M |
3.4 $23.0M |
2.7 $23.0M |
2.2 $20.0M |
| Good Controllable Arms | |||||||||
| 33 | – | Payton Tolle | BOS | SP | 2.3 PRE-ARB |
2.4 PRE-ARB |
2.5 ARB 1 |
2.6 ARB 2 |
2.6 ARB 3 |
| 34 | – | Braxton Ashcraft | PIT | SP | 3.2 PRE-ARB |
3.2 PRE-ARB |
3.1 ARB 1 |
2.9 ARB 2 |
2.7 ARB 3 |
| 35 | – | Parker Messick | CLE | SP | 2.7 PRE-ARB |
2.7 PRE-ARB |
2.7 ARB 1 |
2.6 ARB 2 |
2.5 ARB 3 |
| Wait ‘Til You See Him Hit | |||||||||
| 36 | HM | Samuel Basallo | BAL | C | 2.5 $1.0M |
2.9 $1.0M |
3.4 $4.0M |
3.7 $7.0M |
3.8 $11.0M |
| 37 | 42 | Wyatt Langford | TEX | OF | 4.2 ARB 1 |
4.4 ARB 2 |
4.5 ARB 3 |
||
| Top Prospects | |||||||||
| 38 | HM | Jesús Made | MIL | SS | 1.1 PRE-ARB |
1.6 PRE-ARB |
2.0 PRE-ARB |
2.3 ARB 1 |
2.5 ARB 2 |
| 39 | – | Kade Anderson | SEA | SP | 2.0 PRE-ARB |
2.2 PRE-ARB |
2.4 PRE-ARB |
2.6 ARB 1 |
2.6 ARB 2 |
| Value Plays | |||||||||
| 40 | 43 | Zach Neto | LAA | SS | 3.7 ARB 2 |
3.7 ARB 3 |
3.7 ARB 4 |
||
| 41 | HM | Michael Harris II | ATL | CF | 4.0 $9.0M |
4.0 $10.0M |
4.1 $10.0M |
3.9 $12.0M |
3.5 $15.0M |
| 42 | – | Ben Rice | NYY | 1B | 3.2 PRE-ARB |
3.0 ARB 1 |
2.6 ARB 2 |
2.1 ARB 3 |
|
| 43 | 10 | Ronald Acuña Jr. | ATL | OF | 3.2 $17.0M |
3.0 $17.0M |
|||
| 44 | 20 | Riley Greene | DET | OF | 3.5 ARB 2 |
3.4 ARB 3 |
|||
| 45 | 47 | CJ Abrams | WAS | SS | 3.4 ARB 2 |
3.4 ARB 3 |
|||
| 46 | 22 | Hunter Brown | HOU | SP | 3.3 ARB 2 |
3.2 ARB 3 |
|||
| Tough Calls | |||||||||
| 47 | 31 | Ketel Marte | ARI | 2B | 4.2 $12.0M |
3.1 $20.0M |
2.5 $22.0M |
1.8 $22.0M |
1.2 $11.5M |
| 48 | – | Mason Miller | SDP | RP | 1.9 ARB 2 |
1.8 ARB 3 |
1.7 ARB 4 |
||
| 49 | 42 | Roman Anthony | BOS | OF | 2.8 $4.0M |
3.3 $8.0M |
3.4 $15.0M |
3.6 $19.0M |
3.6 $23.0M |
| 50 | 15 | Fernando Tatis Jr. | SDP | OF | 4.0 $25.0M |
3.7 $25.0M |
3.3 $36.0M |
2.8 $36.0M |
2.4 $36.0M |