

With the trade deadline having come and gone, we’ve officially entered the homestretch of the 2026 season. And while teams surely want to avoid tempting the fury of the fates by assuming they’re postseason-bound, they’d be lying if they said they weren’t thinking about October baseball at least a little bit. And why shouldn’t they? Winning the World Series is the ultimate goal, and many of the league’s playoff-relevant teams made deadline moves for the express purpose of improving their postseason chances.
Before you set out on a vacation, it’s natural, even prudent, to contemplate your trip, though it might mean making plans for a destination you never reach. If you’re heading to the beach, you’re likely going to think about the sun and the sand, even though there’s always a chance the alternator in your 1988 Ford Tempo dies on U.S. Route 50 near Easton, Maryland, forcing you to call your friend Alan on your janky 1990s Motorola “car phone,” only for him to gormlessly drive right past you despite your hazard lights and frantic waving. Baseball has its own broken alternators, injuries and losing streaks that render October plans suddenly irrelevant. Still, teams have good reason to think about what will happen if they get there; after all, it’s important that someone remember to pack sunscreen. And since we’re nerdy baseball fans and have access to a projection system, we might as well look ahead too. So which teams are actually built to be the most dangerous in October, and which ones might be better or worse postseason teams than their regular-season records suggest?
When it comes to projecting October, we have to think about teams somewhat differently than we do during the regular season. Projecting the regular season and a playoff series are two very different tasks. Not because of any playoff-related mythology, or because a team possesses specific characteristics that work better or worse in the postseason, but simply because teams use players very differently in October. It’s not quite as extreme as, say, the difference between how 100m gold medalists and 500m gold medalists are built, but it at least rhymes. In the playoffs, you get to ride your top talent hard since you no longer need to keep them fresh and healthy for a six-month marathon. And because of the postseason’s frequent off days, you also get to have a higher proportion of your innings pitched by the pitchers you actually want in the game.
An example I often point to is the 2019 Washington Nationals. The ZiPS projections thought the Dodgers were clearly a better team than the Nats, and by a good bit, but when it came time to project the NLDS, ZiPS gave Washington almost exactly a coin-flip’s chance of taking down Los Angeles; the Nats ultimately won in five. Not because of any mystique or aura, but because the playoff format hid one of the Nats’ biggest weaknesses: their absolutely horrific pitching depth. Washington leaned heavily on its front four of Stephen Strasburg, Patrick Corbin, Max Scherzer, and Aníbal Sánchez, plus the two relievers the team trusted (Daniel Hudson and Sean Doolittle). That’s not a strategy the Nats could employ for 162 games, but it is something they could manage for the 17 games it took them to win a championship.
With all that in mind, I’ve set up ZiPS to do two things for us. First, let’s project each team’s roster strength over the rest of the 2026 season. This is done the normal way, using the likely depth charts for the last two months. By “roster strength,” I’m referring to the median projected winning percentage that the team would be expected to have if they got to play the rest of the year against league-average teams. This isn’t quite the same as the regular season record since the strength of schedule varies a bit, even with about a quarter of the season to go. Here’s what that rest-of-season roster strength looks like:
ZiPS Roster Strength: August 12
| Team | Roster |
|---|---|
| Los Angeles Dodgers | .603 |
| Philadelphia Phillies | .550 |
| Chicago Cubs | .549 |
| New York Yankees | .547 |
| Milwaukee Brewers | .546 |
| Boston Red Sox | .545 |
| Seattle Mariners | .537 |
| Atlanta Braves | .534 |
| Toronto Blue Jays | .514 |
| Tampa Bay Rays | .512 |
| New York Mets | .512 |
| San Diego Padres | .512 |
| Houston Astros | .511 |
| Cleveland Guardians | .508 |
| Arizona Diamondbacks | .507 |
| Detroit Tigers | .507 |
| Texas Rangers | .501 |
| Pittsburgh Pirates | .499 |
| Baltimore Orioles | .497 |
| Minnesota Twins | .488 |
| San Francisco Giants | .487 |
| Miami Marlins | .476 |
| Kansas City Royals | .476 |
| Chicago White Sox | .474 |
| St. Louis Cardinals | .472 |
| Cincinnati Reds | .471 |
| Athletics | .446 |
| Los Angeles Angels | .429 |
| Washington Nationals | .408 |
| Colorado Rockies | .380 |
No real surprises here. After all, these are just the straight-up projections! Where things get interesting is when I completely redo these projected roster strengths to reflect postseason usage. That means more playing time for the stars and the top of the rotation/bullpen, and a lot less time off for the starters. I’ve trimmed the chart down to only show the teams that we currently project as having at least a one-in-six chance of making the playoffs. I’ve also compared the difference between their postseason roster strength and regular season roster strength, which is how this table this sorted:
You Aren’t a FanGraphs Member
It looks like you aren’t yet a FanGraphs Member (or aren’t logged in). We aren’t mad, just disappointed.
We get it. You want to read this article. But before we let you get back to it, we’d like to point out a few of the good reasons why you should become a Member.
1. Ad Free viewing! We won’t bug you with this ad, or any other.
2. Unlimited articles! Non-Members only get to read 10 free articles a month. Members never get cut off.
3. Dark mode and Classic mode!
4. Custom player page dashboards! Choose the player cards you want, in the order you want them.
5. One-click data exports! Export our projections and leaderboards for your personal projects.
6. Remove the photos on the home page! (Honestly, this doesn’t sound so great to us, but some people wanted it, and we like to give our Members what they want.)
7. Even more Steamer projections! We have handedness, percentile, and context neutral projections available for Members only.
8. Get FanGraphs Walk-Off, a customized year end review! Find out exactly how you used FanGraphs this year, and how that compares to other Members. Don’t be a victim of FOMO.
9. A weekly mailbag column, exclusively for Members.
10. Help support FanGraphs and our entire staff! Our Members provide us with critical resources to improve the site and deliver new features!
We hope you’ll consider a Membership today, for yourself or as a gift! And we realize this has been an awfully long sales pitch, so we’ve also removed all the other ads in this article. We didn’t want to overdo it.
ZiPS Playoff Roster Strength
| Team | Playoff | Reg Season | Diff |
|---|---|---|---|
| New York Yankees | .578 | .547 | .031 |
| San Diego Padres | .537 | .512 | .025 |
| Tampa Bay Rays | .533 | .512 | .021 |
| Arizona Diamondbacks | .522 | .507 | .015 |
| Texas Rangers | .514 | .501 | .013 |
| Los Angeles Dodgers | .613 | .603 | .009 |
| Detroit Tigers | .512 | .507 | .006 |
| Houston Astros | .512 | .511 | .001 |
| Chicago White Sox | .474 | .474 | .000 |
| Philadelphia Phillies | .546 | .550 | -.003 |
| Minnesota Twins | .484 | .488 | -.004 |
| Chicago Cubs | .541 | .549 | -.008 |
| Atlanta Braves | .526 | .534 | -.008 |
| Milwaukee Brewers | .536 | .546 | -.010 |
| Seattle Mariners | .525 | .537 | -.012 |
| Cleveland Guardians | .488 | .508 | -.020 |
| Boston Red Sox | .523 | .545 | -.021 |
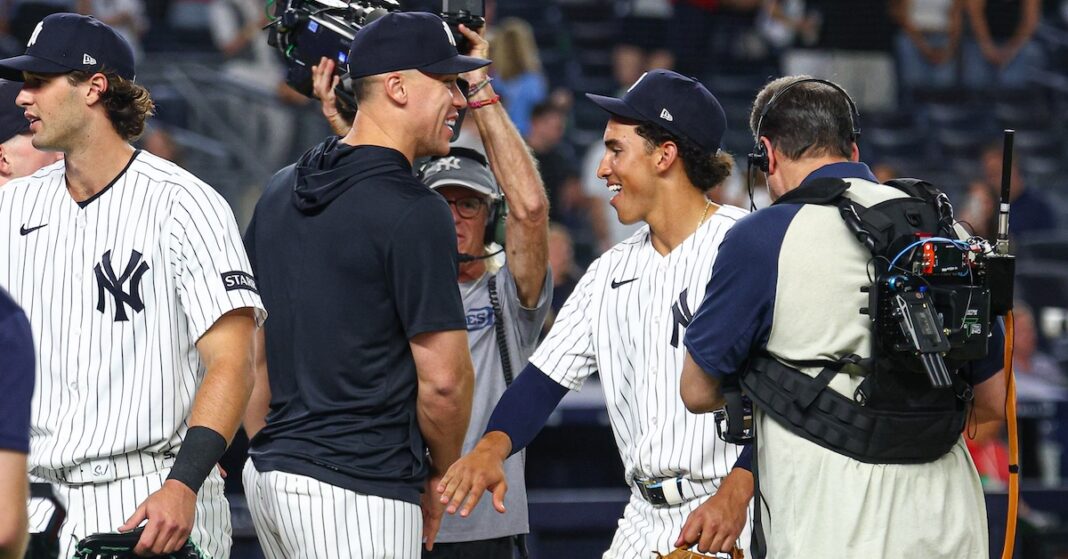
There’s one big thing that ZiPS doesn’t like about the regular season Yankees: the team’s lack of Aaron Judge and Cody Bellinger. Bellinger is reportedly getting closer to a return (it appears Carlos Rodón is too) while Judge remains a shrug emoji, but put them on the postseason roster and the Yankees become a lot more dangerous. A four-man playoff rotation of Max Fried, Cam Schlittler, Gerrit Cole, and Rodón would be a scary one, and the front end of the bullpen has been terrific.
Of the 17 potential playoff teams listed here, the Padres only rank 10th in regular season strength, but they jump up to fifth if you’re just talking about playoff strength. Outside of Sung-Mun Song, ZiPS isn’t thrilled about San Diego’s plan B at any position, and the playoff rotation looks a lot more threatening than the current one. Now, the Padres bullpen is deep enough that they don’t need to fake it like the Nats did, but they still don’t have to worry as much about counting innings for Mason Miller and Adrian Morejon. Similarly, the Diamondbacks don’t have to worry about a fifth starter or fret quite as much about their fourth starter in October, and their offensive value is efficiently compressed into just a few players.
On the flip side are the Guardians and the Red Sox, who see the biggest drop-offs from their regular season projections. ZiPS isn’t as excited about Parker Messick as you might expect given his numbers this year, leaving Cleveland short of an ace, which most of the other playoff teams have. The team’s mediocre offense has a very high floor in ZiPS, but also a very low ceiling, which isn’t great for postseason baseball. As for the Red Sox, ZiPS sees Boston’s depth of quality players as the team’s strength, and anticipates them having a harder time getting all of that value onto the field in the playoffs than they do during the regular season.
Of course, we’ll have to wait until October to see what actually happens, but for now, these are the projections! Underestimate the Padres at your own risk.
One postscript: That Ford Tempo went through six alternators. I do not miss it.